Canadian Consumer Goods Manufacturing
 pocosdotca on October 8th, 2012
In the last blog post (click here to read) we saw that the manufacturing industry significantly contributes to the Canadian economy – to the tune of $162 Billion in output in 2011. This represents roughly 13% of the Canadian economy’s output [$1,271 Billion in 2011].
But where do manufactured consumer goods fit into all of this? POCOs.ca exists to connect Canadians to consumer goods made in Canada. While it is great that Canadians are employed in the fabrication of airplane parts (ex. Boeing) and city buses (ex. New Flyer), I don’t know too many retail consumers who are in the market for these types of products. So let’s look at what types of consumer goods are made in Canada and how many people are involved in the production of these everyday items.
What’s a Consumer Good? – Check out my previous blog post on the topic here. A consumer good is essentially a final products that is ready for personal consumption, this includes: clothes, cars, furniture, appliances, etc. Food and beverages would generally fall into this classification; however, to keep things simple we focus on non-food goods here at POCOs.ca.
I wasn’t able to find any hard numbers on the amount of production or the number of people employed in the consumer goods manufacturing sector within Canada. So I scrapped together an aggregate view of this sector by looking at the employment and production figures for different industries within the NAICS [North American Industry Classification System] data provided by Industry Canada. This should paint a sufficiently clear picture of the Canadian consumer goods manufacturing sector, let’s have a look:
Clothing Manufacturing: Manufactured clothing including knit clothing, cut and sew apparel, and clothing accessories.
Examples: socks, shirts, underwear, pjs, hats, gloves, scarves, etc.
Production (Value Added): $1,300M          Annual Growth Rate (since 2001): -12.5%
Employment: 25,670                         Annual Growth Rate (since 2001): -14.6%
Footwear Manufacturing: All footwear, any material
Examples: running shoes, work boots, dress shoes, etc.
Production (Value Added): $109M            Annual Growth Rate (since 2001): -8.9%
Employment: 2,392                          Annual Growth Rate (since 2001): -9.3%
Leather Products:
Examples: wallets, luggage, purses, handbags, etc.
Production (Value Added): $62M           Annual Growth Rate (since 2001): -7.4%
Employment: 1,120                          Annual Growth Rate (since 2001): -10.8%
Paper Products:
Examples: loose leaf paper, exercise books, note pads, diapers, toilet paper, etc.
Production (Value Added): $614M            Annual Growth Rate (since 2001): -2.7%
Employment: 4,525                          Annual Growth Rate (since 2001): -3.8%
Printing: Printed materials for personal consumption
Examples: artwork (prints), screen printed clothing, trading cards (think hockey), etc.
Production (Value Added): $3,986M          Annual Growth Rate (since 2001): -2.5%
Employment: 40,271                         Annual Growth Rate (since 2001): -3.6%
Chemical Manufacturing: Chemically-based products manufactured for personal and household use.
Examples: bleach, hand soap, laundry soap, toothpaste, deodorant, etc.
Production (Value Added): $1,400M          Annual Growth Rate (since 2001): -1.4%
Employment: 10,438                         Annual Growth Rate (since 2001): -2.7%
Metal Hand Tools:
Examples: axes, clippers, cutlery, saw blades, etc.
Production (Value Added): $338M            Annual Growth Rate (since 2001): 1.0%
Employment: 3,959                          Annual Growth Rate (since 2001): -2.4%
Household Appliances: Small and large appliances
Examples: can openers, frying pans, dishwashers, fridges, stoves, water heaters, etc.
Production (Value Added): $500M            Annual Growth Rate (since 2001): -5.1%
Employment: 4,414                          Annual Growth Rate (since 2001): -6.7%
Transportation Equipment: Personal transportation equipment.
Examples: cars, vans, light trucks, boats, canoes, kayaks, etc.
Production (Value Added): $8,247M          Annual Growth Rate (since 2001): -8.8%
Employment: 31,280                         Annual Growth Rate (since 2001): -4.6%
Furniture: Household use.
Examples: couches, upholstered furniture, wood furniture, mattresses etc.
Production (Value Added): $1,657M          Annual Growth Rate (since 2001): -4.4%
Employment: 24,572                         Annual Growth Rate (since 2001): -5.0%
Other: Consumer goods not covered by one of the above categories.
Examples: jewellery, silverware, toys and games, sports equipment, office supplies, etc.
Production (Value Added): $1,572M          Annual Growth Rate (since 2001): -5.3%
Employment: 11,194                         Annual Growth Rate (since 2001): -5.3%
Production (Value Added): $19,171M
Employment: 155,310
I agree, here are two inforgraphics that sum it all up nicely:
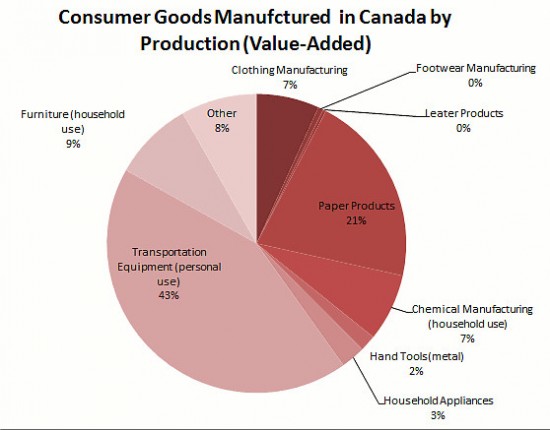
When we break the consumer goods manufacturing sector down by production (the contribution each industry group makes to Canada’s GDP), a few things stand out:
- Transportation manufacturing makes up a big piece of this pie, accounting for 43% of GDP added within the consumer goods industry.
- Paper Products is the second largest contributor to GDP within the consumer goods industry, account for 21% of production.
- Furniture, Clothing, and Chemical manufacturing are notable players too with their production contributions floating around 10% of the consumer goods industry.
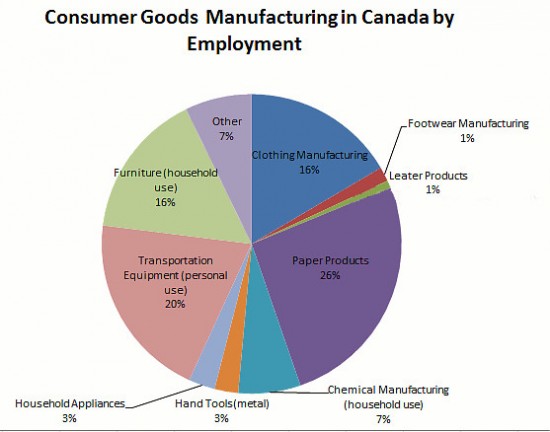
The picture changes a little when we break the consumer goods sector down by employment:
- Although transportation manufacturing contributes the most to GDP, it is not the largest employer. The paper production industry employs more and represents 26% of employment in the consumer goods sector.
- Transportation manufacturing, furniture production, and clothing are the next three largest employers with each industry floating around 20% of the consumer goods sector.
- Chemical manufacturing (household chemicals) is the fifth largest from an employment perspective, accounting for 7% of employment.
So what does it all mean? Here are a few closing thoughts on the numbers and graphics shown above:
From the numbers I scrapped together from the Industry Canada site, the consumer goods sector generates $19.2 Billion in value-added output (GDP contribution), this represents roughly 12% of the $162.1 Billion in GDP contributed by the Canadian manufacturing industry. From an employment stand-point, the consumer goods sector also represents approximately 12% of the total manufacturing industry.
I should mention that the figures shown above are likely on the conservative side. There were a few instances when manufactured consumer goods fell into the same NAICS categories as intermediate or capital goods. For example, manufactured kitty litter (a consumer good) was classified in the same category as embalming fluids (an intermediate good used by funeral homes). Also, bicycles (a consumer good) fell into the same category wit armoured military vehicles (a capital good used by the military). In cases where consumer goods and intermediate or capital goods were mixed, I did not include those figures in my numbers above – resulting in an understatement on the breadth of consumer goods manufacturing in Canada.
Elsewhere on the Industry Canada site, they state that the consumer goods sector (in this instances they included the food and beverage industries) represents one third (33%) of the GDP generated by the manufacturing industries and 40% of employment within the manufacturing industry. As POCOs.ca does not focus on the food and beverage manufacturing, the consumer goods sector as discussed on this site is smaller than the Industry Canada figures; however, the true numbers on employment and production within the consumer goods sector likely lie somewhere in between today’s conservative estimates and the more liberal figures provided by Industry Canada. All in all, to sum everything up – the consumer goods manufacturing sector within Canada is no small potatoes!
- Kevin
POCOs.ca


